
Oruscal is an Excel too built to allow the calibration of RUSLE2 by assuming the simplified situation of a hillslope with a regular slope profile for tree crops such as vines, olives or almonds. It is aimed for educational use and training on evaluation of water erosion through RUSLE, facilitating the understanding the erosion risk of different management by stakeholders, or other applications such as comparison of erosion risk among different management, soil, temperature and rainfall regimes. For more complex situations, e.g. complex slope profiles, any interested user should use the full RUSLE2 software. The structure and main input data of the tool are explained in the model, as well as in the accompanying instructions. ORUSCAL calculates in each one of the Excel sheets each RUSLE factor or subfactors. Each factor is accompanied by a set of explanations and accompanying information to allow their determination, indicating, when necessary, sources of this information (for example rainfall erosivity) or data taken from the RUSLE 2.0 database (e.g. root biomass for different orchard management. This allows their use in situations with limited data in a straightforward way for users with limited programming or modelling training, allowing the use of a combination of field measurements(for instance evaluation of ground cover) complemented with data from other sources.
Introducción – Tutorial
These instructions are aimed to provide any user with the basic information to run ORUSCAL. It assumes a basic understanding of RUSLE and Excel, and they follow the same structure than ORUSCAL. That is that they will explain sheet to sheet starting from sheet #2 at the left side “1_Introduction”, which appears after the “0 Disclaimer” sheet , to the one farthest to the right “20 General”.
Sheet 2 “1_Introduction” provides a basic definition of ORUSCAL, a Flowchart of calculations and data input, and some references
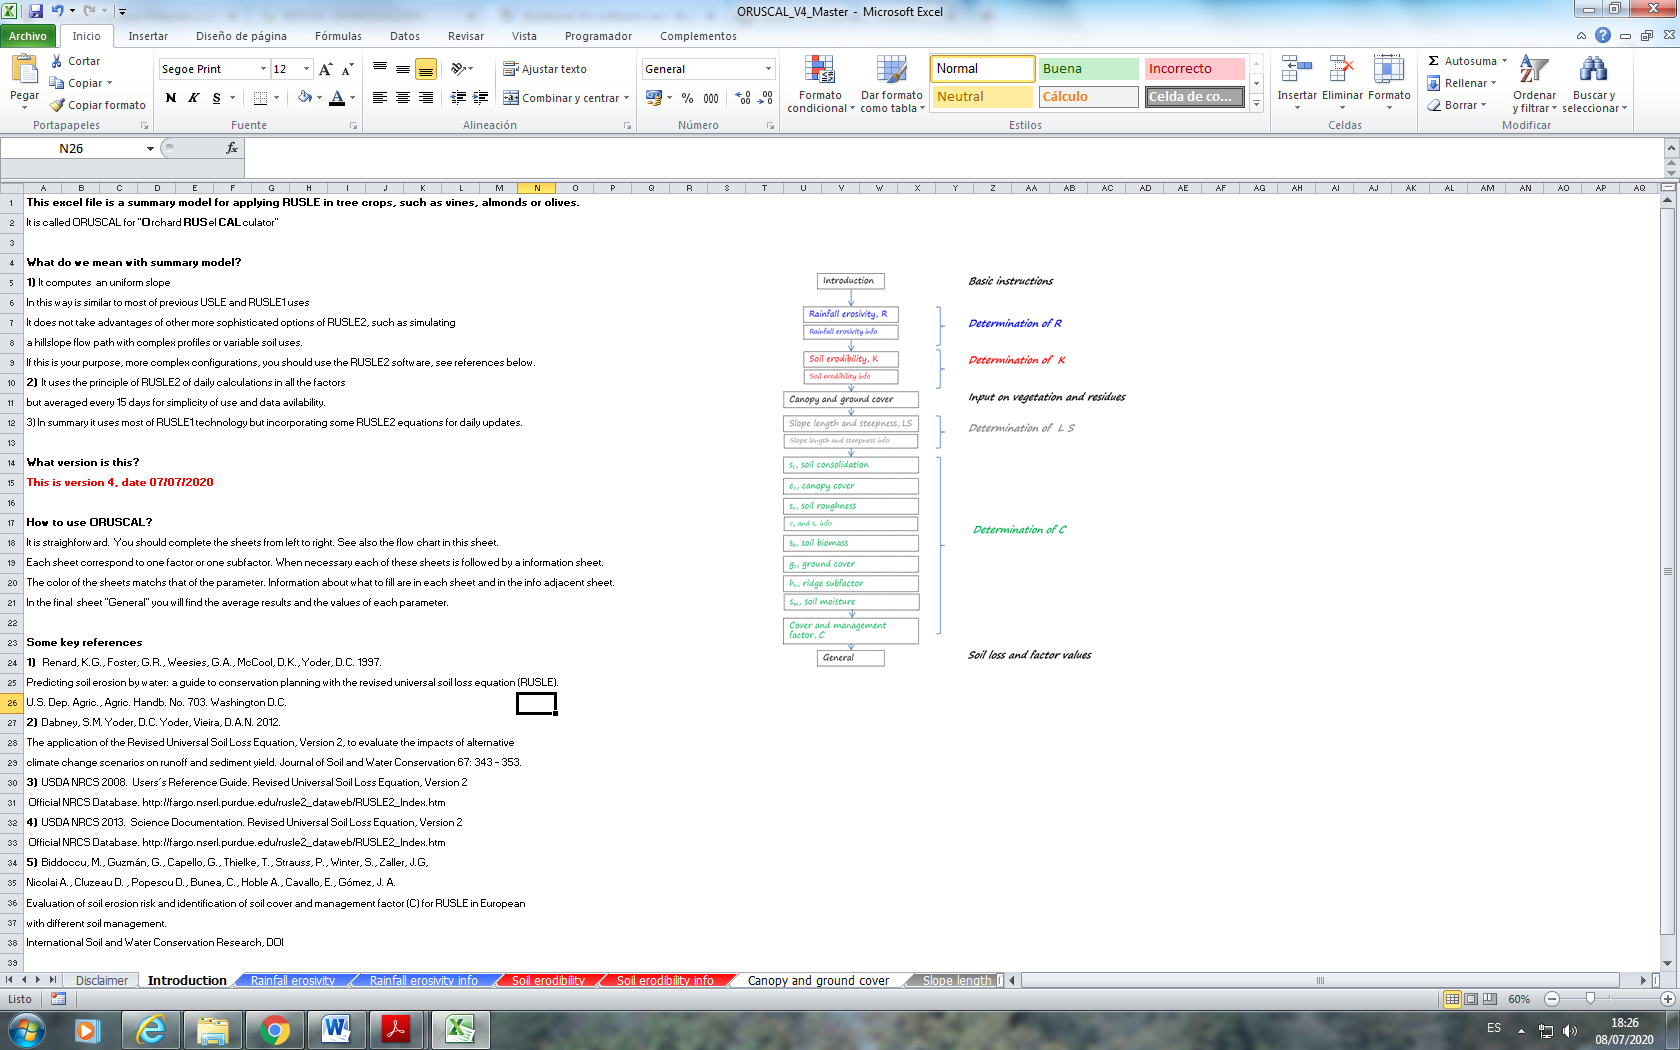
Figure 1: View of sheet “1_Introduction”.
In each sheet of the model, all the cells are blocked with the exception of those that are used to introduce data (always colored in blue). This is a precaution to prevent messing with the formulas by mistake, or crashing the model. In case the model crashes by some unexpected value in the input data it should restore clicking the undo bottom in excel. If not you can download again a clean version to start again.
2. Rainfall erosivity, R.
Sheets “2_Rainfall erosivity” and “3_Rainfall erosivity info” contain the input data, calculations and information for determination of rainfall erosivity, R. It is coded to work always in SI units.
We assume two basic situations for using RUSLE. One is for individual years. In this case you need to introduce R values calculated for each quarter. It is what we call option 2 and you choose it typing 2 in cell N2. If you have calculated previously the daily rainfall erosivity data from breakpoint values you simply copy and paste this into cells G43 to G407, you have also to type 2 into cell D36. If you still want to use this option but you do not have erosivity value it is possible to approximate daily R values if you have daily rainfall and you know the relationship between daily rainfall and erosivity using an exponential function of the type R = a Pb. To do this Type 1 into cell D36, the values of a and b in cells D38 and D39, and daily rainfall in cells E43 to E407. Rainfall erosivity will appear in column F43 to F407. In both cases the model will aggregate them into quarter values and depicted in cells I8 to I31 and graphs to its right.
If you only have the average erosivity values from maps with its seasonal distribution by quarter you can calculate ORUSCAL for the average value. It is what we call option 1 and you choose it typing 1 in cell N1. Later on you add the annual average rainfall erosivity in cell D5 and the proportion of annual R that falls in each quarter in cells F8 to F31.
Sheet “3_Rainfall erosivity info” provide some basic information on R.
3. Soil erodibility, K.
Sheets “4 Soil erodibility” and “5 Soil erodibility info” contain the input data, calculations and information for determination of soil erodibility, K. It is coded to work always in SI units. You can calculate K according to the standard RUSLE nomograph. For this you will need to add information on particle size distribution (texture), OM, soil structure and infiltration class. Sheet “6 Soil erodibility info” has information to complete this. You will have the option to use a different nomograph for disturbed soils by cell E17. It also gives you the option to use a K calculated externally from a different function or database. To do this, you need to type 1 in cell E24 and write the K value in cell E25. At this stage you have already provided the information to use a constant K value for the whole year if you have typed 2 in cell E20.
You will have the alternative of using a variable K value through the empirical correlation provided by RUSLE2 typing 1 in cell E20. Even if you do not use variable K value, the model needs that you introduce the daily rainfall, as well as maximum and minimum Tº at this point. This is because they will be used in further calculations. They have to be added in cells C61:C425, F61:F425 and G61:G425. If you are running ORUSCAL for the average year choose a year with a representative average Tª and rainfall. If you only have average daily Tª, simply paste it twice on columns F61:F425 and G61:G425. Also note that the use of a variable K value is not compatible with using a variable sm subfactor (see section 13). So if you plan to use a variable sm subfactor you must choose a constant K value.
4. Canopy and ground cover.
The sheet “6 Canopy and ground cover” it is separated from other sections because the information in it can be called for the determination of more than one factor or subfactor. It is important to understand properly each parameter’s meaning. Ground cover of the tree (vines or olives for instance) in cells D14:D37 means the ground cover at each quarter always referred to the projected area of the tree at maximum growth. For instance if your tree plants covers (at maximum growth) 40 % of the plot (with the rest being lanes) and you have a 95 % ground cover below the tree plants in, (e.g. in August) you must type 95% here. The same has to be done with the cover crop area in cells E14:E37. In another sheet you will have the opportunity to provide the dimensions to determine the relative proportion of lane and tree row area.
Note that for the other two variables, ground cover by vegetation residues and by rock fragments to be typed in cells F14:F37 and G14:G37 respectively the approach is different. In these two variables you are requested to provide a ground cover for the whole plot (averaging between lane and plant area). This is because these input parameters are used differently by RUSLE, and therefore by ORUSCAL.
5. Slope length and steepnes, L S.
ORUSCAL uses the standard RUSLE equations for determining in sheets “7 Slope length and steepness” and “8 Slope length and steepness info” the S and L factors. This implies that we are using equations developed mostly from experimental data coming from a range of 0.1-18% slope steepness. If you need to perform an analysis in which slope steepness is above this range we refer you to the full RUSLE 2.0 model (USDA-NRCS, 2013) where other equations are available, or studies like the one of Liu et al. (1994). Although it
is a section with limited information to provide, it refers to variables that are critical when predicting soil erosion. Pay attention to the m exponent, see cell F10 where you will have the option to let the model calculate an m value per quarter or the alternative of using a constant m value based on your best estimation on the dominant erosion process. Predictions are very sensitive to this m value, with increasing erosion for higher m values. If you have doubts, the more conservative approach is to use 0.5, which is the value for an intermediate situation between dominance of rill and interrill erosion.
Liu, B.Y., Nearing, M.A., Risse, L.M. 1994. Slope gradient effects on soil loss for steep slopes. Transactions of the ASAE 37: 1835-1840.
USDA NRCS 2013. Science Documentation. Revised Universal Soil Loss Equation, Version
- Official NRCS Database. http://fargo.nserl.purdue.edu/rusle2_dataweb/RUSLE2_Index.htm
6. sc, soil consolidation subfactor
This subfactor, in sheet “9 sc, soil consolidation” it is the first of the seven subfactors included in the determination of the soil and management factor, C. It considers the effect of the consolidation in reducing erosion risk at the long term when you stop tilling compare to other management systems. If you are going to simulate a situation where there is some tillage, type 1 in cell I14 and if not, type 2. However, for a consolidated soil status we recommend to force the model to use a sc value of 1. This is because there is very little information on the interaction of this subfactor outside field crops conditions, and in fact, there are experiments demonstrating in orchards that over-consolidated lanes with bare soils present higher soil loss that tilled bare lanes. To do this, in cell I16 type a positive value close to zero, e.g. 0.01.
7. cc, canopy cover subfactor
This subfactor, in sheet “10 cc, canopy cover” it is the second of the seven factors included in the determination of the soil and management factor, C. It refers to soil protection by the standing vegetation, and completes the information in sheet “6 Canopy and ground cover”. You have to provide the percentage of the plot covered by the plant area, cell I3, and the percent covered by the lane area, cell I28. You may have a doubt here, when there is a situation where only part of the lane area has a cover crop (for instance a narrow band covering only the center). In this case you can approximate the average ground cover in this lane area by the values introduced in sheet 6 “Canopy and ground cover”, go to section 4
8. sr, soil roughtness subfactor
This subfactor, in sheet “11 sr, soil roughness” it is the third of the seven factors included in the determination of the soil and management factor, C. It refers to the protection of the increased roughness against erosion. It is related with sheet “12 cc and sr info” where you can find information including the values from RUSLE database for the tillage tools that you might need. It is important to remember that the RUSLE manual clearly indicates that you must use the roughness values from RUSLE database and not those measured from another source since they might not be compatible with the equations developed for this model due to units and measurement methods.
In sheet 11 you will need to provide firstly information from the soil tillage operations that you need to describe, typing in the corresponding sections of cells in block A12 to L21. You will find the required information for this in sheet “12 cc and sr info”. After this, you will go through section A26 to I26. If you do not perform any kind of tillage operation you will not need to type anything. If you are simulating a situation with no tillage you have to introduce the parameters that results in a surface roughness, in line 26, which shows the representative situation for your management. An easier alternative is going to cell E28 is where you have the choice to indicate that you want a constant roughness indicating a surface which has not been disturbed by tillage.
To simulate degradation of tillage roughness by rainfall you need to use rainfall and erosivity data. For model decay of soil roughness due to rainfall, the model uses rainfall erosivity, R. If you used as a best approximation of R the one calculated from daily rainfall (see section 2) they will be linked to this section. If you did not use this option you will be asked to be back to page “2 Rainfall Erosivity” to introduce those data. Finally you have to
indicate the date and type of tillage operations during the year. For this, you go to cells H42:H406 and type for the corresponding date the code of the tillage operation that you defined in the block of cells A11 to L21. The code for each line is the number in column A. You have a maximum of 10 different operations to define and choose. Information on parameters of these tillage options can be found in sheet “12 cc and sr info”.
We need to check changes in this cell
9. sb, soil biomass subfactor
This subfactor, in “13 sb, soil biomass” it is the fourth of the seven factors included in the determination of the soil and management factor, C. It refers to the reduction of erosion due to the presence of biomass in the soil. It is accompanied by “14 sb info” where you can find tables (extracted from the RUSLE 2.0 database) with information of soil biomass under different conditions. You can choose among them to fill the necessary information in sheet 14 if you do not have experimental measurements to use. You need to add the information for the soil biomass due to roots in cells D15:D38 and from plant residues from cells E15:E38. Remember that if you do not incorporate these plant residues into the soil, then they cannot be counted as soil biomass. Note also the units (lb acre-1 inch-1 averaged for the top 10 inches, 25 cm, of the soil) with weight always on a dry weight basis.
10. gc, ground cover subfactor
This subfactor, in sheet “15 gc, ground cover” it is the fifth of the seven factors included in the determination of the soil and management factor, C. It refers to the reduction of erosion by presence of material directly deposited on the soil surface, such as plant residues, stones or another mulching material. Note that this cover differs from that it was provided by standing vegetation, cc subfactor (section 7).
The most updated version of RUSLE calculates the value for gc subfactor for each quarter using information already provided for previous factors and subfactors. To choose this option you only need to type the value of the parameter defining the conformance of the material providing ground cover in your situation in cell F10 among the value closest to your situation. Choose among the values included in cells A11 to A13.
11. hr, ridge subfactor
This subfactor in sheet “16 hr, ridge subfactor” it is the sixth of the seven factors included in the determination of the soil and management factor, C. It refers to the modification of the erosion ridge for the effect of the orientation of the furrows, reducing for contouring and increasing if it is exactly up-down the slope. Do not confuse this factor with the contour tillage used by RUSLE in the support practice factor.
This another of the RUSLE subfactor not used in many situations. You may want to skip this subfactor if you are working in a situation where this effect might be not relevant, e.g. cover crops, or shallow tillage, or you do not understand clearly what you are doing there is the option of not using this subfactor typing 1 in cell F6. However, if you choose to use it, you have to provide the ridge orientation relative to the maximum slope, in cell F11. In cell F8 you will see a reminder if you are using a variable ridge height, which you should set in the sheet corresponding to surface roughness (sr, section 8).
13. sm, soil moisture subfactor
This subfactor in sheet “17 sm, soil moisture” and the accompanying information in sheet “18 sm, info” it is the seventh of the seven factors included in the determination of the soil and management factor, C. It refers to the modification of the erosion risk due to the variation of soil water content, being higher with higher soil water content. Previous studies in Mediterranean conditions in olives orchards and vines suggest that this evolution of soil moisture plays a major role in the modification of erosion losses during different periods within the year and among different years. It gives you the option to use it typing 1 in cell I3. If you type 2 in cell I3 you avoid using this subfactor. Remember that if you use a variable K value during the year (see section 3, K) you cannot use this subfactor.
To determine a sm subfactor you have to introduce some soil parameters in cells I11 to I15. The model gives you two options. One is to estimate a sm value for each day using the rainfall and climate records already introduced, calculating an approximate soil water balance using FAO Kc methodology (see sheet 18 “sm, info”). The another alternative is that you determine this soil water balance externally with a more sophisticated water balance model and introduce the calculated sm values externally, considering a linear relationship between sm equal to 1 (top soil at field capacity) and sm equal to zero (permanent wilting point), in cells M6:M29.
14. C, cover and management factor.
This sheet, “19 Cover and management factor”, depicts the results of the calculations of the different calculations of the C subfactors during the different quarters. It gives you the chance to have an overall check of the results and the reasons for the modification of C factor under the changes in cover and management, Figure 2.
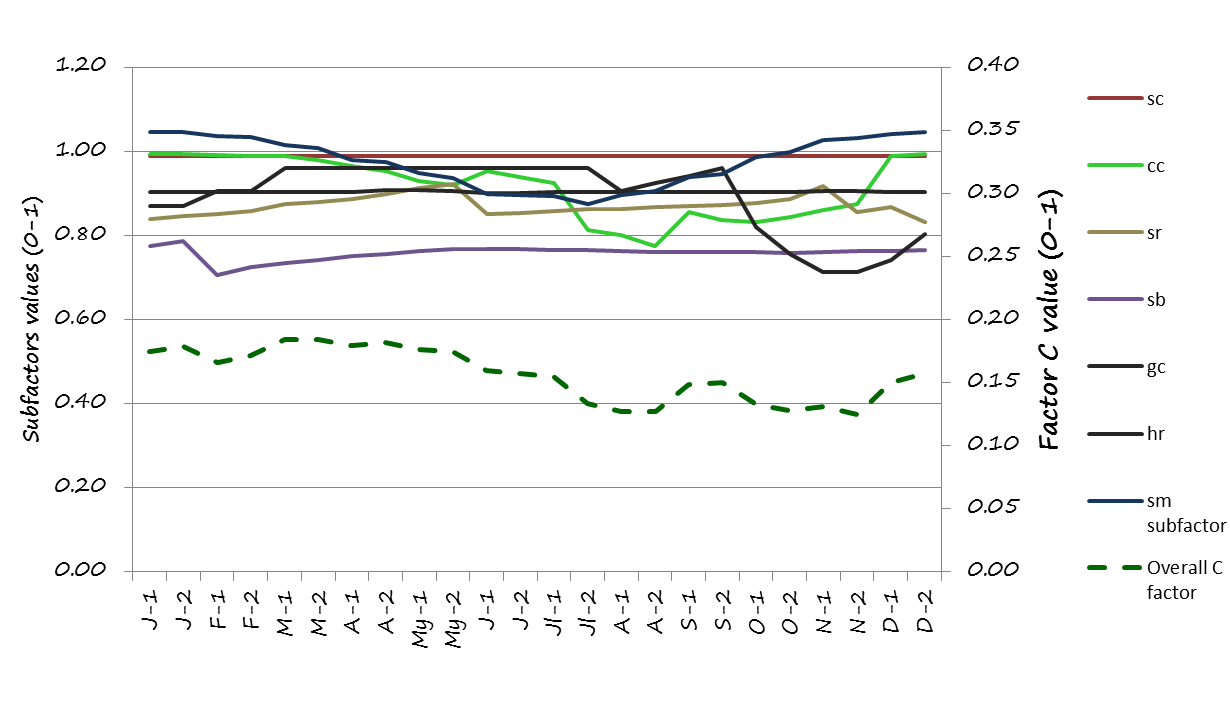
Figure 2: Summary chart of quarterly C factor and subfactors.
15. General.
This final sheet, “20 General”, depicts the final annual and quarter values of the different factors,and the resulting estimated soil losses, see Figure 3.
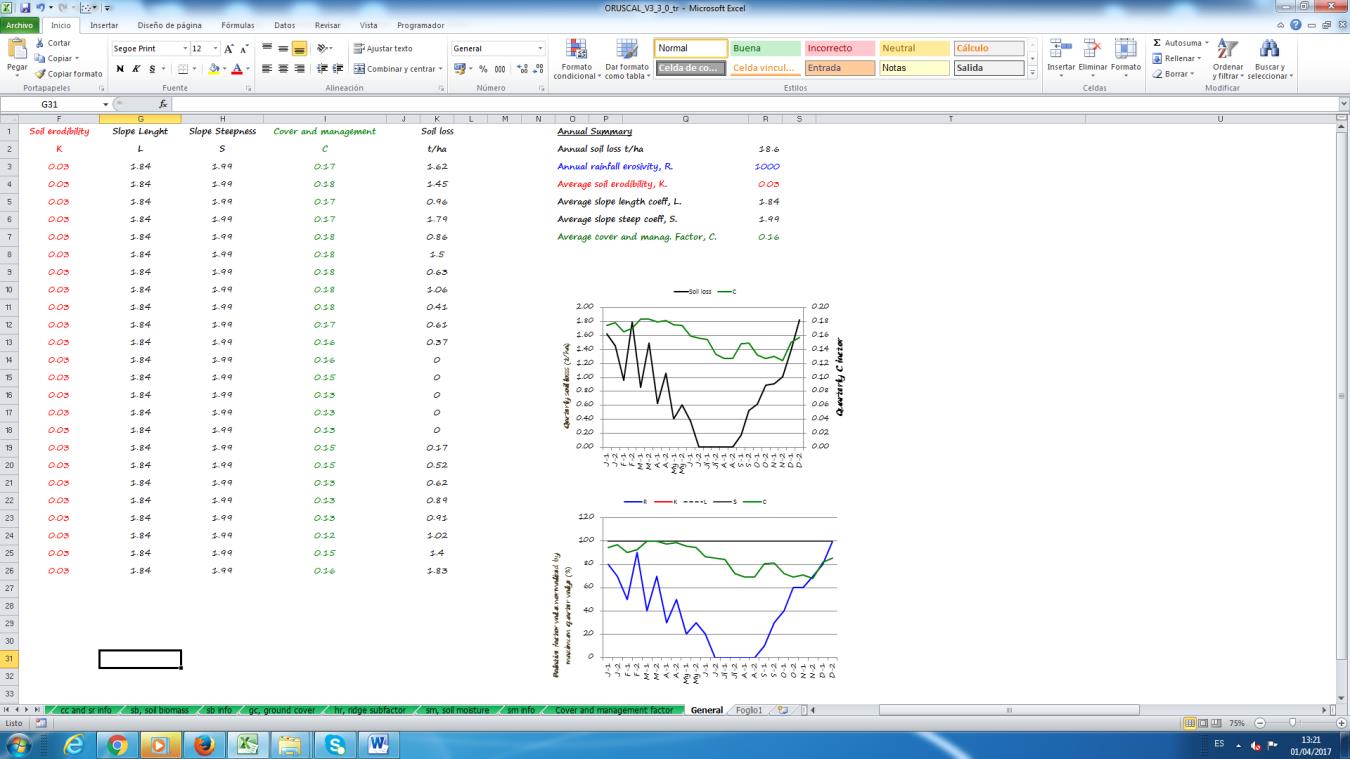
Figure 3. Overview of sheet 20, “General”, depicting the results of the calculations.
Once that you have completed the simulations the easiest way to keep them is to save this excel with a different name. In this way you can keep as many simulations as you want simply keeping the corresponding excels file.